Every number, explained. Nothing hidden.
This page pulls the complete statistics of the AD Quant System live account from Myfxbook every day and explains what each one means — so you can judge the system the way a professional allocator would, not from a screenshot.
How a professional reads this account.
Retail marketing shows you the gain. Allocators look at the shape of the gain: how much was risked to get it, how consistent it is, and whether the edge exists on both sides of the market. These six statistics answer that.
What it measures. Gross profit divided by gross loss. A profit factor of 2 means the system earned $2 for every $1 it lost.
Why investors care. It is the single most honest measure of an edge. Anything above 1.5 is considered robust; retail strategies rarely sustain above 3.
What it says here. At the account has earned more than three and a half dollars for every dollar lost. This is not a lucky streak of a few trades — it holds across closed positions.
What it measures. The largest peak-to-valley fall in account value, in percent. It is the worst moment an investor would have lived through.
Why investors care. Drawdown decides whether you can psychologically and financially stay in a system long enough for the edge to pay. Most retail EAs run 20–60% drawdowns; funds consider under 10% conservative.
What it says here. A maximum drawdown of means the account has, at its worst, given back about one-eighth of its value from a high — well inside the 20% hard equity stop that closes everything if it is ever reached. That ceiling is the design; the live figure shows how much of it has actually been used.
What it measures. The average amount the system makes each time it trades, wins and losses included. Also shown in pips: pips per trade.
Why investors care. A positive expectancy means every additional trade adds money on average. Combined with trade frequency it tells you how the account compounds over time.
What it says here. Every trade adds on a cent account at the default 0.01 lot — positive, consistent and enough to produce a average monthly gain. Scale the lot size and the expectancy scales with it — use the calculator to see your own numbers.
What it measures. The percentage of closed trades that ended in profit — split here into longs ( of , ) and shorts ( of , ).
Why investors care. Win rate on its own can be gamed by tiny wins and huge losses. It only matters together with the win/loss size ratio below — and here both are positive.
What it says here. Roughly two out of three trades close in profit, and the edge is present on both sides of the market. The system is not simply riding a Bitcoin uptrend: shorts win too.
What it measures. How much bigger the typical winning trade is than the typical losing trade. Average win against average loss .
Why investors care. Most basket and grid systems show a high win rate but an average loss many times the average win — the losses arrive rarely, then all at once. A ratio above 1 together with a high win rate is the rare combination.
What it says here. Winners are about the size of losers and the win rate is high. AD Quant System is a cycle-based system — positions are closed together when a cycle reaches its profit target, and a hard equity stop caps the worst case — yet the closed-trade record shows small, contained losses rather than the occasional large one. That is why the profit factor is so far above the norm.
What it measures. The average time a position stays open, from entry to exit.
Why investors care. Short holding times mean capital is not trapped for weeks in an underwater position, and overnight risk is limited to what the system chose to hold.
What it says here. Positions average under a day. No trade is left open for weeks hoping the market returns, which is the behaviour that destroys most retail accounts.
The statistics most sellers never show you.
These are harder to read, which is exactly why they are useful: they cannot be dressed up with a nice equity curve.
What it measures. How widely individual trade results are spread around the average. Lower means more consistent trade outcomes.
Why investors care. Consistency is what allows an investor to size a position rationally. A wide spread means the average hides wild individual results.
What it says here. A spread of per trade on a cent account, with the best trade at and the worst at only . The largest win is roughly ten times the largest loss: the outliers are on the upside, not the downside.
What it measures. Average return per trade divided by the variability of those returns — reward per unit of risk.
Why investors care. Higher is better, but be careful comparing across sources: Myfxbook reports its own Sharpe based on daily returns and shows 0.00 on young or low-variance cent accounts. The figure here is computed per trade from the actual history.
What it says here. Myfxbook reports 0.00 on this young account, which is normal in the first weeks of a track record. As the history lengthens this figure becomes meaningful; today the profit factor and drawdown carry more weight.
What it measures. A statistical test of whether wins and losses come in streaks or at random. Values beyond ±1.96 are significant at 95%.
Why investors care. A strongly negative Z-score means wins tend to follow wins — the system enters a regime and stays right for a while. Positive means outcomes alternate. Either can be exploited; randomness cannot.
What it says here. A Z-score of shows winning trades cluster together — consistent with a cycle-based logic in which the positions of one cycle close in profit together, rather than each entry being an independent coin flip.
What it measures. Arithmetic and geometric average return per trade as a percentage of the account. GHPR is what you actually compound at.
Why investors care. When AHPR and GHPR are equal, drawdowns are not eroding compounding — variance drag is negligible.
What it says here. AHPR and GHPR are within a hundredth of a percent of each other: variance drag is small, so nearly all of what is earned per trade is actually compounded.
The complete Myfxbook table.
| Statistic | Value | Meaning |
|---|---|---|
| Trades | Closed positions. A sample above 100 is where statistics start to mean something. | |
| Total pips | Sum of pips won across all trades — independent of lot size. | |
| Average win | pips / | Typical size of a winning trade. |
| Average loss | pips / | Typical size of a losing trade — about 60% of the average win in money terms. |
| Lots traded | Total volume. Small by design at the default 0.01 base lot. | |
| Commissions | Zero: results are net of trading costs on this account type. | |
| Longs won | / () | Buy trades. The majority of positions, reflecting Bitcoin's structural drift. |
| Shorts won | / () | Sell trades. Profitable shorts prove the system is not simply long-biased. |
| Best trade | Largest single win. | |
| Worst trade | Largest single loss — about one-tenth of the best trade. Losses are cut; winners are allowed to run. | |
| Average trade length | Mean holding time. | |
| Profit factor | Gross profit ÷ gross loss. | |
| Standard deviation | Spread of individual trade results. | |
| Sharpe ratio (per trade) | Reward per unit of variability. Myfxbook's own daily-based figure may differ. | |
| Z-score | Streak dependency between consecutive trades. | |
| Expectancy | pips / | Average result per trade. |
| AHPR / GHPR | / | Arithmetic / geometric return per trade. |
| Balance / equity | / | Equity ≈ balance: no hidden floating losses. |
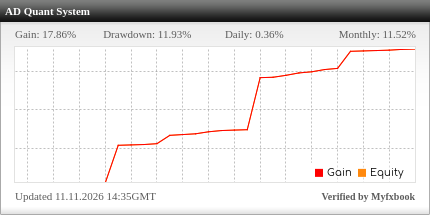
Why these statistics are unusual — and why they matter more than the gain.
- The edge is real, not a streak. A profit factor of across trades, on both long and short sides, is not something a lucky month produces.
- The risk taken to earn it is tiny. Maximum drawdown of is moderate for the gain produced and sits well inside the 20% equity stop. Most systems advertising similar monthly gains hide 30–60% drawdowns.
- The worst case is defined in advance, not discovered later. AD Quant System is a cycle-based system: positions in a cycle are closed together at a profit target (default 0.65% of balance), a 12-hour cooldown follows every cycle, and a hard equity stop (default 20%) closes everything if drawdown ever reaches it. The live account has so far used about half of that ceiling at its worst — the ceiling exists and you set it yourself.
- What you earn, you keep. AHPR and GHPR are nearly equal and equity tracks balance — variance drag is small and there is no hidden floating loss waiting to surface.
- It is verifiable by you, today. Every figure on this page is refreshed daily from the public Myfxbook tracker. Follow it for a week before spending a cent; if the numbers stop making sense, walk away.
Risk warning: trading cryptocurrencies on margin carries a high level of risk. Past performance, however well verified, is not indicative of future results. Statistics are computed from the account's trade history; Myfxbook's own presentation of some ratios (notably Sharpe) may use a different method.